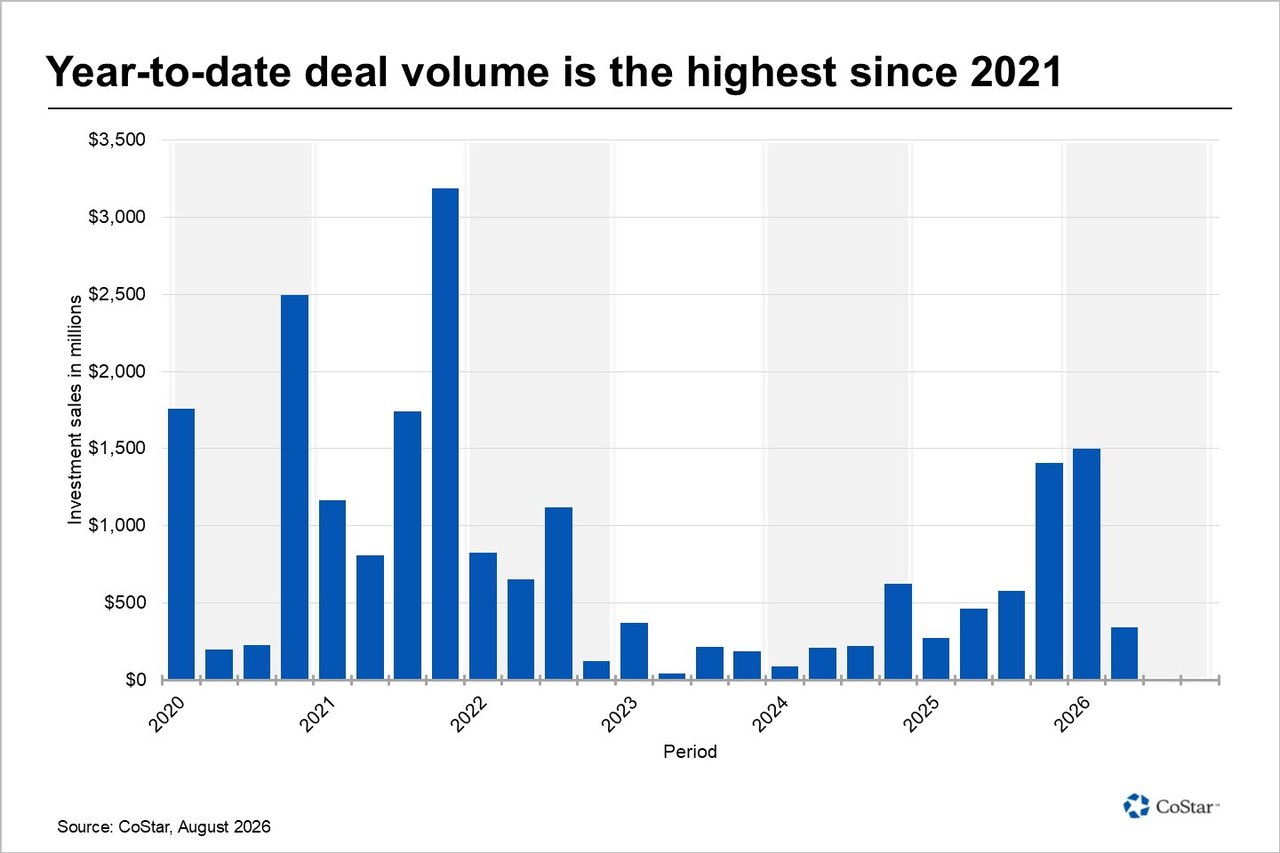
San Francisco’s office investment market lost momentum in the second quarter after an exceptionally strong start to 2026. Quarterly sales volume dropped to $334.4 million from $1.5 billion in the first quarter, a decline of roughly 78%, according to CoStar data. That decline followed one of the strongest quarters the market has recorded since the pandemic, and it underscores how heavily recent transaction activity has been driven by a small number of very large sales.
First half volume more than doubled year over year
Despite the quarter over quarter slowdown, first half activity remained well ahead of last year’s pace. Combined sales volume totaled $1.83 billion in the first six months of 2026 against $736.3 million in the first half of 2025.
Investors have stayed active in San Francisco. What changed between the two quarters was not appetite. It was deal timing and the presence of one outsized transaction.
One deal drove the first quarter
The first quarter was dominated by a single headline trade. The Transamerica Pyramid changed hands in March for approximately $691.6 million, sold by the ownership group of Michael Shvo, Deutsche Finance America and Bayerische Versorgungskammer to Cyprus based Yoda PLC. It was among the largest office transactions in the city since the pandemic and it single handedly pushed quarterly volume far above recent norms. The group had acquired the property in 2020 for roughly $650 million and invested heavily in it after that, so the sale closed at a loss.
The other notable first quarter trade was 123 Mission Street. The 363,000 square foot tower, purchased by Juul Labs for close to $400 million in 2019 and sitting at roughly 13% leased, transferred in the low $90 million range through a deed in lieu of foreclosure to Madison Capital in partnership with a Prudential affiliate. It stands as one of the clearest examples of where pricing lands on a largely vacant asset.
Second quarter activity was smaller but healthier
Second quarter volume was anchored by a shorter list of deals, though the quality of those deals matters more than the total does.
The most prominent was One De Haro in Showplace Square, a 133,427 square foot office and R&D building fully leased to Samsara. It sold for approximately $103 million, or roughly $771 per square foot, from SKS Partners to Strada Investment Group.
In San Mateo County, several buildings at Pacific Shores in Redwood City traded, including 1400 Seaport Boulevard at a reported $94.4 million. Back in San Francisco, Lone Star Funds and Harvest Properties recapitalized 600 California Street in May.
The pattern is consistent. Leased buildings are clearing at credible pricing. Empty buildings are clearing close to land value. That is a market that is functioning, not one that is frozen.
Fundamentals continue to improve underneath the volume numbers
The slower second quarter pace comes while office fundamentals keep moving in the right direction.
CoStar reports San Francisco absorbed roughly 4.8 million square feet of office space over the trailing twelve months, with vacancy down to 20.6%. CBRE, which measures a different inventory set, put second quarter vacancy at 29.2% with 963,980 square feet of positive net absorption in the quarter alone. The two firms count different buildings, so the levels differ. The direction does not.
Leasing demand has been led by artificial intelligence, technology, biotechnology and professional services tenants. Investor interest is concentrating on newer, fully leased properties and on buildings positioned to benefit from continued leasing recovery, while value add and distressed opportunities remain a meaningful share of the transaction landscape.
What it means going forward
The second quarter pullback looks dramatic in isolation and largely disappears when you widen the frame. The first half points to a market considerably more active than a year ago, with institutional and opportunistic capital reengaging as leasing conditions improve.
The risk worth naming is concentration. When one transaction can swing a quarter by a billion dollars, quarterly volume is a poor read on market health. Absorption and vacancy are the better indicators, and both are improving. The same demand drivers filling office space, particularly AI hiring inside city limits, are also tightening the San Francisco multifamily market, which is where the effect on rents and values shows up next.
Frequently asked questions
How much San Francisco office space sold in Q2 2026?
Roughly $334.4 million, down from about $1.5 billion in the first quarter, according to CoStar. First half 2026 volume totaled approximately $1.83 billion.
What was the largest San Francisco office sale of 2026 so far?
The Transamerica Pyramid, which sold in March 2026 for approximately $691.6 million.
What is the San Francisco office vacancy rate in 2026?
CoStar reports 20.6%. CBRE reports 29.2% for the second quarter using a different inventory base. Both show vacancy falling year over year.
Thinking about buying or selling in San Francisco?
I track this market every day and I am happy to run current numbers on your property.
Philip Batlin
Managing Director Investments, Marcus & Millichap
750 Battery Street, Fifth Floor, San Francisco, CA 94111
O: (415) 625-2189 | C: (415) 254-7071
[email protected]
CA License 01873218