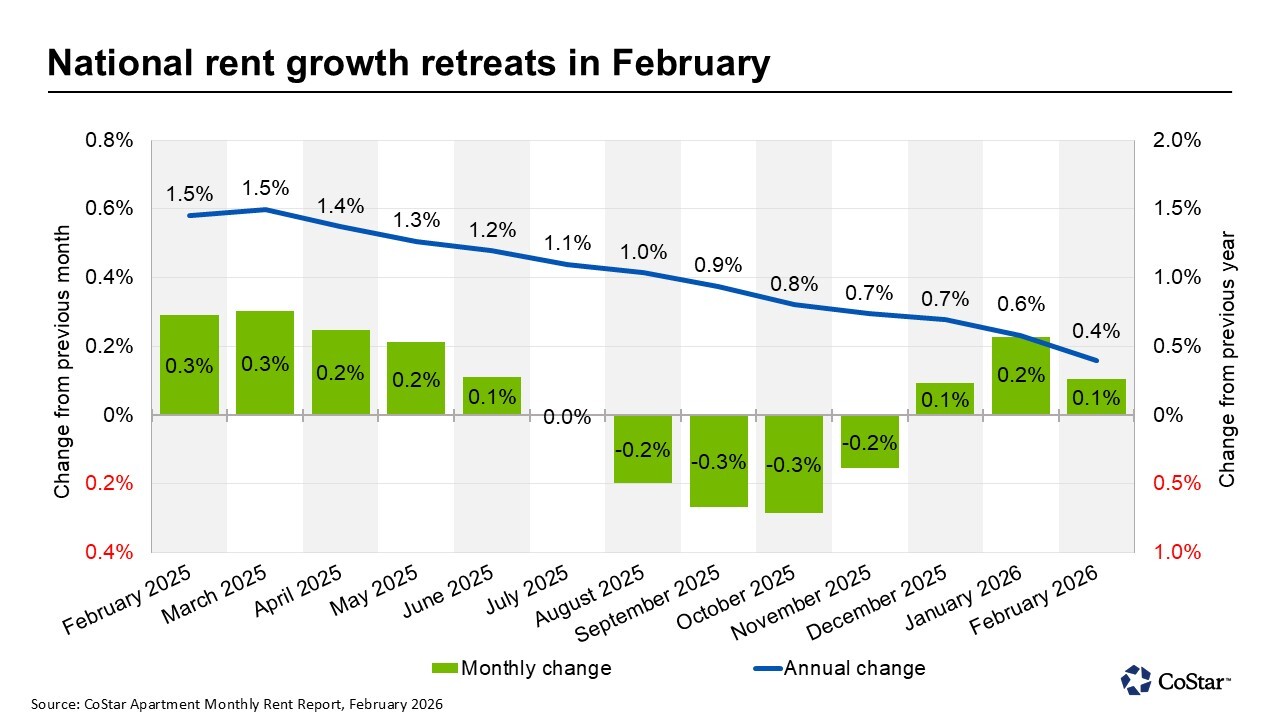
U.S. apartment rents increased in February 2026, with the national average apartment rent reaching $1,716 — a modest +0.1% increase from January’s upwardly revised $1,714, according to Apartments.com's latest multifamily rent trends report.
This marks the third consecutive monthly gain since the trend turned positive in December 2025, following five months of flat or declining rents. However, the pace remains moderated, and annual rent growth eased to +0.4% in February 2026 (down from +0.6% in January and +1.5% in February 2025).
Apartment rents typically follow seasonal patterns, accelerating in spring/summer. February 2026's increase was below the historical seasonal average of +0.3% (2010–2025 data), as elevated supply pressures from recent construction continue to weigh on momentum nationwide.
 National Apartment Rent Trends February 2026: Key Stats
- National average rent: $1,716 (+$2 MoM, +0.1%)
- Monthly change: +0.1% (third straight positive month)
- Annual change: +0.4% (slowing from prior months)
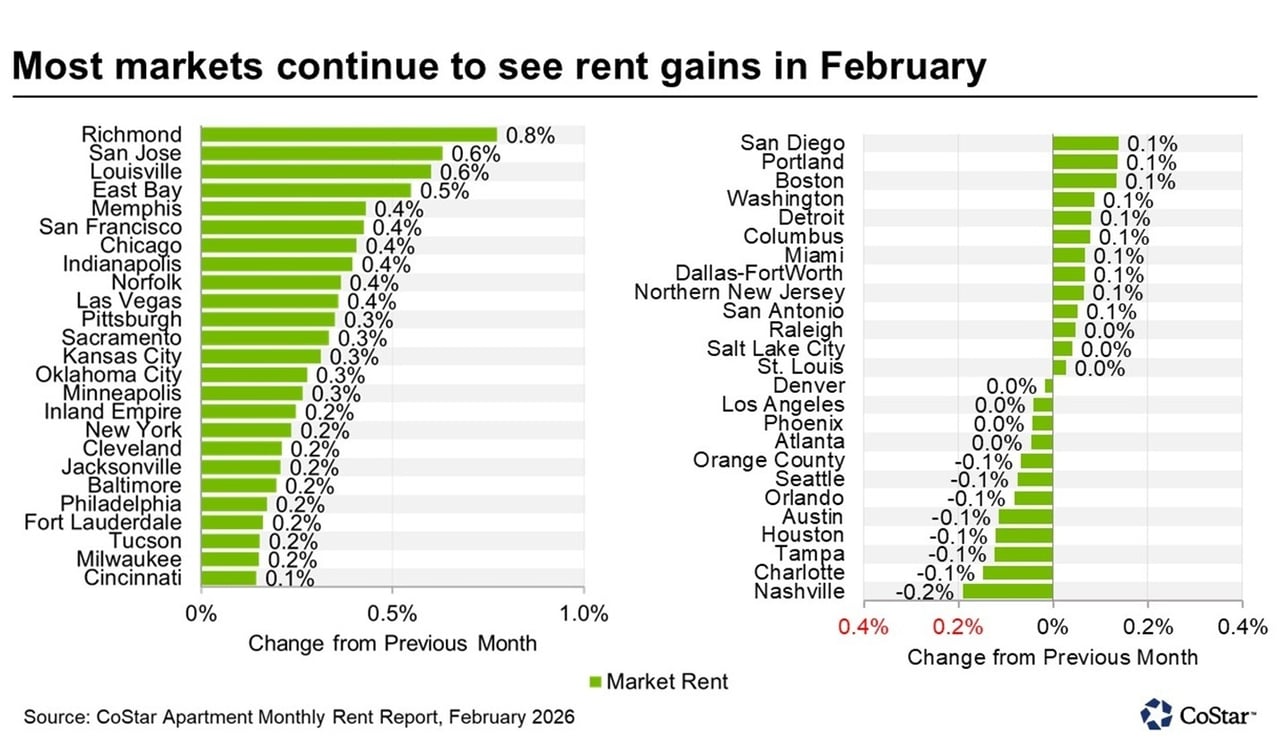
- Metros with increases: 38 of top 50 (down from 42 in January)
Metro-Level Highlights: Uneven Performance in US Multifamily Rent Growth
Supply-heavy markets (especially Sun Belt) face higher vacancies and downward pressure, while constrained-supply areas outperform.
Strongest Monthly Gains:
- Richmond, VA: +0.8%
- San Jose, CA: +0.6%
- Louisville, KY: +0.6%
Notable Monthly Declines:
- Nashville, TN: -0.2%
- Average -0.1% in Charlotte, NC; Tampa, FL; Houston, TX; Austin, TX; Orlando, FL; Seattle, WA; Orange County, CA
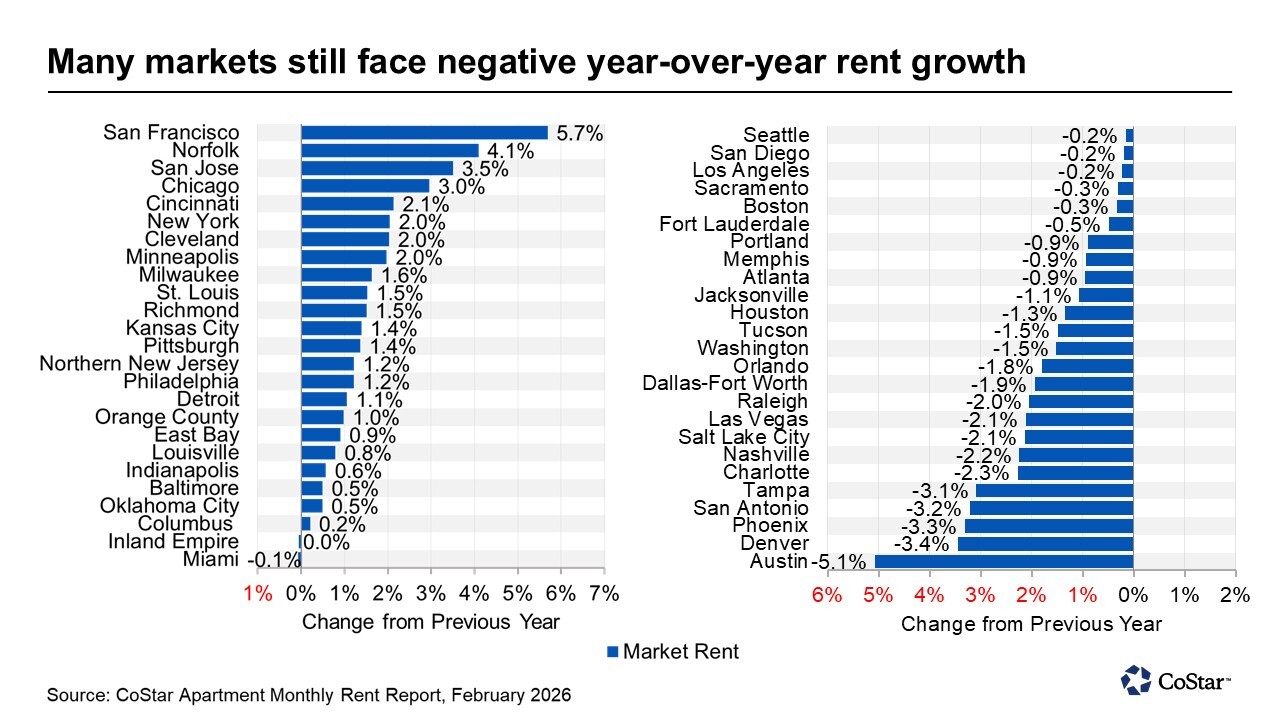
Strongest Annual Increases:
- San Francisco, CA: +5.7%
- Norfolk, VA: +4.1%
- San Jose, CA: +3.5%
- Chicago, IL: +3.0%
Steepest Annual Declines:
- Austin, TX: -5.1%
- Denver, CO: -3.4%
- Phoenix, AZ: -3.3%
These patterns highlight a clear divide: Markets with high new construction (many Sun Belt cities) see the weakest US apartment rent trends 2026, while supply-limited areas in the Midwest and select coastal regions (including strong Bay Area performance) hold up better. Softening local demand or employment in some spots may also play a role.
(Suggested Image Placement Here – e.g., national rent trend chart) Alt text: "US national apartment rent trends February 2026 chart showing $1,716 average and +0.1% monthly increase – Apartments.com/CoStar data"
Why Supply Overhang Continues to Impact Rent Growth
Elevated inventory from post-pandemic construction deliveries is muting typical early-year gains. Many metros are still absorbing units, leading to higher vacancies and competitive pricing — especially in oversupplied Sun Belt markets.
For San Jose and Bay Area renters/investors: Local rents bucked the national slowdown with +0.6% MoM and +3.5% YoY, reflecting stronger demand in supply-constrained coastal tech hubs.
(Internal links: Link to "January 2026 Rent Report" / "San Jose Apartment Rent Trends" / related CoStar articles)
FAQ: US Apartment Rent Trends February 2026
What is the national average apartment rent in February 2026? $1,716, up +0.1% from January.
Are US apartment rents still rising in 2026? Yes, modestly month-over-month for the third straight month, but annual growth has slowed to +0.4% due to inventory pressures.
Which cities have the highest rent growth in February 2026? San Francisco (+5.7% YoY), Norfolk (+4.1%), San Jose (+3.5%).
Why are rents declining in some markets? Oversupply from new construction in Sun Belt cities like Austin, Denver, and Phoenix is outpacing demand.